
Making plots and static or interactive visualizations is one of the most important tasks in data analysis. It may be a part of the exploratory process; for example, helping identify outliers, needed data transformations, or coming up with ideas for models.
matplotlib.pyplot is a plotting library used for 2D graphics in python programming language. It can be used in python scripts, shell, web application servers and other graphical user interface toolkits.
Matploitlib is a Python Library used for plotting, this python library provides and objected-oriented APIs for integrating plots into applications.
Before start plotting let us understand some basics
- With Pyplot, you can use the xlabel() and ylabel() functions to set a label for the x- and y-axis.
- With Pyplot, you can use the grid() function to add grid lines to the plot.
- You can use the keyword argument linestyle, or shorter ls, to change the style of the plotted line:
- The plot() function is used to draw points (markers) in a diagram. By default, the plot() function draws a line from point to point.
- You can use the keyword argument marker to emphasize each point with a specified marker.
Figures and Subplots
1.The subplots() function takes three arguments that describes the layout of the figure.
2.The layout is organized in rows and columns, which are represented by the first and second argument.
3.The third argument represents the index of the current plot.
Example-1: plt.subplot(1, 2, 1) #the figure has 1 row, 2 columns, and this plot is the first plot.
Example-2: plt.subplot(1, 2, 2) #the figure has 1 row, 2 columns, and this plot is the second plot.
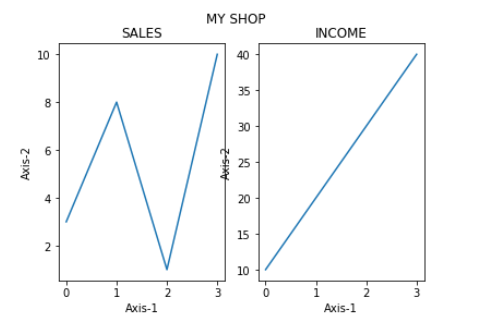
Example program
import matplotlib.pyplot as plt
import numpy as np
#plot 1:
x = np.array([0, 1, 2, 3])
y = np.array([3, 8, 1, 10])
plt.subplot(1, 2, 1)
plt.plot(x,y)
plt.title("SALES")

#plot 2:
x = np.array([0, 1, 2, 3])
y = np.array([10, 20, 30, 40])
plt.subplot(1, 2, 2)
plt.plot(x,y)
plt.title("INCOME")

plt.suptitle("MY SHOP")
plt.show()
Output
0 comments :
Post a Comment
Note: only a member of this blog may post a comment.