

1. The mean absolute error
The mean absolute error (MAE) is the sum of all the numbers that were predicted and those that were actually found. The MAE is a linear score, which means that each difference is given the same amount of weight in the overall number. It gives you an idea of how wrong they were. The measurement gives an idea of the error's size but not its direction (e.g., whether it's too high or too low).
2. The mean squared error
The mean squared error (MSE) shows the sample standard deviation of the residuals, which are the gaps between what was expected and what was actually seen. This is like the mean absolute error in that it gives you a general idea of how big the mistake is. By taking the square root of the mean squared error, you can change the units back to the ones that came with the output variable. This can be useful for showing and explaining things. The root mean squared error (RMSE) is the name for this.4.Adjusted R² metric
Just like R², adjusted R² also shows how well terms fit a curve or line but adjusts for the number of terms in a model. It is given in the following formula:
where n is the total number of observations and k is the number of predictors. Adjusted R² will always be less than or equal to R².
Selecting an evaluation metric for supervised regression
In terms of a preference among these evaluation metrics, if the main goal is predictive accuracy, then RMSE is best. It is computationally simple and is easily differentiable. The loss is symmetric, but larger errors weigh more in the calculation. The MAEs are symmetric but do not weigh larger errors more. R² and adjusted R² are often used for explanatory purposes by indicating how well the selected independent variable(s) explains the variability in the dependent variable(s).
Let us first look at the evaluation metrics for supervised classification.
Classification
For simplicity, we will mostly discuss things in terms of a binary classification problem (i.e., only two outcomes, such as true or false); some common terms are:
- True positives (TP)
-
Predicted positive and are actually positive.
- False positives (FP)
-
Predicted positive and are actually negative.
- True negatives (TN)
-
Predicted negative and are actually negative.
- False negatives (FN)
-
Predicted negative and are actually positive.
The difference between three commonly used evaluation metrics for classification, accuracy, precision, and recall, is illustrated in below Figur
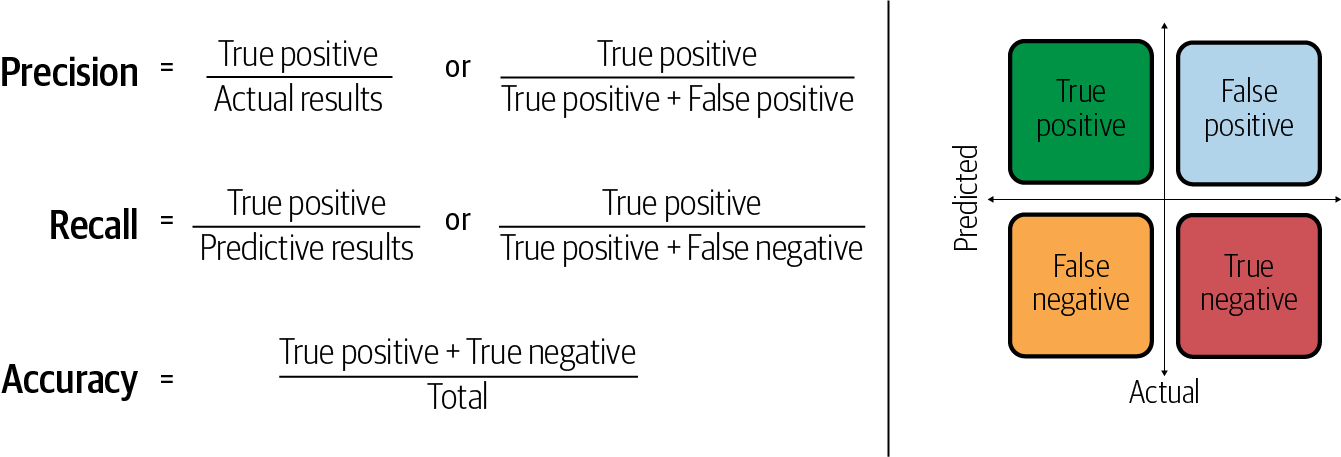
1.Accuracy
As shown in above figure , accuracy is the number of correct predictions made as a ratio of all predictions made. This is the most common evaluation metric for classification problems and is also the most misused. It is most suitable when there are an equal number of observations in each class (which is rarely the case) and when all predictions and the related prediction errors are equally important, which is often not the case.
2.Precision
Precision is the percentage of positive instances out of the total predicted positive instances. Here, the denominator is the model prediction done as positive from the whole given dataset. Precision is a good measure to determine when the cost of false positives is high (e.g., email spam detection).
3.Recall
Recall (or sensitivity or true positive rate) is the percentage of positive instances out of the total actual positive instances. Therefore, the denominator (true positive + false negative) is the actual number of positive instances present in the dataset. Recall is a good measure when there is a high cost associated with false negatives (e.g., fraud detection).
In addition to accuracy, precision, and recall, some of the other commonly used evaluation metrics for classification are discussed in the following sections.
4.Area under ROC curve
Area under ROC curve (AUC) is an evaluation metric for binary classification problems. ROC is a probability curve, and AUC represents degree or measure of separability. It tells how much the model is capable of distinguishing between classes. The higher the AUC, the better the model is at predicting zeros as zeros and ones as ones. An AUC of 0.5 means that the model has no class separation capacity whatsoever. The probabilistic interpretation of the AUC score is that if you randomly choose a positive case and a negative case, the probability that the positive case outranks the negative case according to the classifier is given by the AUC.
5.Confusion matrix
A confusion matrix lays out the performance of a learning algorithm. The confusion matrix is simply a square matrix that reports the counts of the true positive (TP), true negative (TN), false positive (FP), and false negative (FN) predictions of a classifier, as shown in below figure.
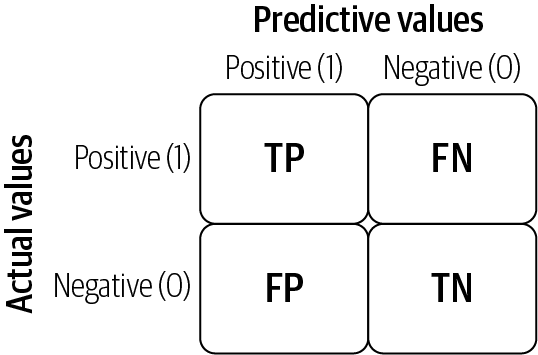
The confusion matrix is a handy presentation of the accuracy of a model with two or more classes. The table presents predictions on the x-axis and accuracy outcomes on the y-axis. The cells of the table are the number of predictions made by the model. For example, a model can predict zero or one, and each prediction may actually have been a zero or a one. Predictions for zero that were actually zero appear in the cell for prediction = 0 and actual = 0, whereas predictions for zero that were actually one appear in the cell for prediction = 0 and actual = 1.
Selecting an evaluation metric for supervised classification
The evaluation metric for classification depends heavily on the task at hand. For example, recall is a good measure when there is a high cost associated with false negatives such as fraud detection. We will further examine these evaluation metrics in the case- Machine Learning and Data Science Blueprints for Finance Book by Brad Lookabaugh, Hariom Tatsat, and Sahil Puri
0 comments :
Post a Comment
Note: only a member of this blog may post a comment.